10 Analytical Report Examples You Need to See in 2025

In the modern agency, data isn't just a byproduct; it's the engine of growth. Yet, many teams drown in spreadsheets and dashboards, struggling to separate noise from the signal. The critical difference between stagnant performance and sustainable success often lies in the ability to craft analytical reports that don't just present numbers, but tell a compelling, actionable story.
This guide moves beyond theory, breaking down 10 essential analytical report examples that top-performing agencies and businesses use to make smarter, faster decisions. We're not just showing you finished products; we're dissecting their strategic DNA. For each example, you will get an annotated breakdown of its structure, a close look at the key metrics that truly matter, and sample visuals that clarify complex information.
More importantly, this listicle is built for action. You'll find ready-to-use templates and checklists showing exactly how you can adapt these reports for your own clients or internal projects. Forget generic success stories. We'll explore the specific tactics and replicable strategies behind each report, from financial performance and marketing ROI to product adoption and project post-mortems. It's time to transform your data from a confusing flood of information into your most powerful strategic asset. This collection of analytical report examples is your blueprint for turning insights into decisive, growth-driving action.
1. Financial Performance Analysis Report
A Financial Performance Analysis Report is a cornerstone of business intelligence, offering a rigorous examination of a company's financial health. It translates raw financial data from income statements, balance sheets, and cash flow statements into actionable insights about profitability, liquidity, solvency, and operational efficiency. This type of report moves beyond simple profit and loss, providing stakeholders with a clear, evidence-based view of financial viability and long-term trends.
This report is essential for strategic planning, investor relations, and internal decision-making. By analyzing key financial ratios and historical data, it helps leaders identify strengths, weaknesses, and opportunities for growth, making it one of the most fundamental analytical report examples for any organization.

Strategic Breakdown
Financial analysis reports are famously used in Warren Buffett's annual letters to Berkshire Hathaway shareholders, where complex financial data is distilled into a clear narrative. Similarly, major financial news platforms like Bloomberg and Reuters build their entire business on providing this kind of in-depth analysis for publicly traded companies like Apple and Tesla. The core strategy is to use data to tell a story about the company's performance and future potential.
Key Insight: A strong financial report doesn't just present numbers; it interprets them. The analysis should explain why metrics have changed and what those changes signify for the company's future. For instance, rising revenue is good, but if it comes with disproportionately higher costs, the report must highlight the eroding profit margins.
Actionable Takeaways for Your Agency
Agencies can use this format for internal health checks or for client business reviews.
- Benchmark Performance: Compare key metrics like Gross Profit Margin and Net Profit Margin against industry averages to see how your agency stacks up against competitors.
- Identify Trends: Track metrics over the past 3-5 years. A consistent decline in your Current Ratio (current assets / current liabilities) could signal a future cash flow problem.
- Focus on Cash Flow: Profit doesn't always equal cash. Analyze the Statement of Cash Flows to understand where cash is truly coming from and where it’s being spent, ensuring operational sustainability.
- Investigate Variances: If your accounts receivable collection period suddenly jumps from 30 to 60 days, this report forces you to investigate the cause-perhaps a new client has unfavorable payment terms.
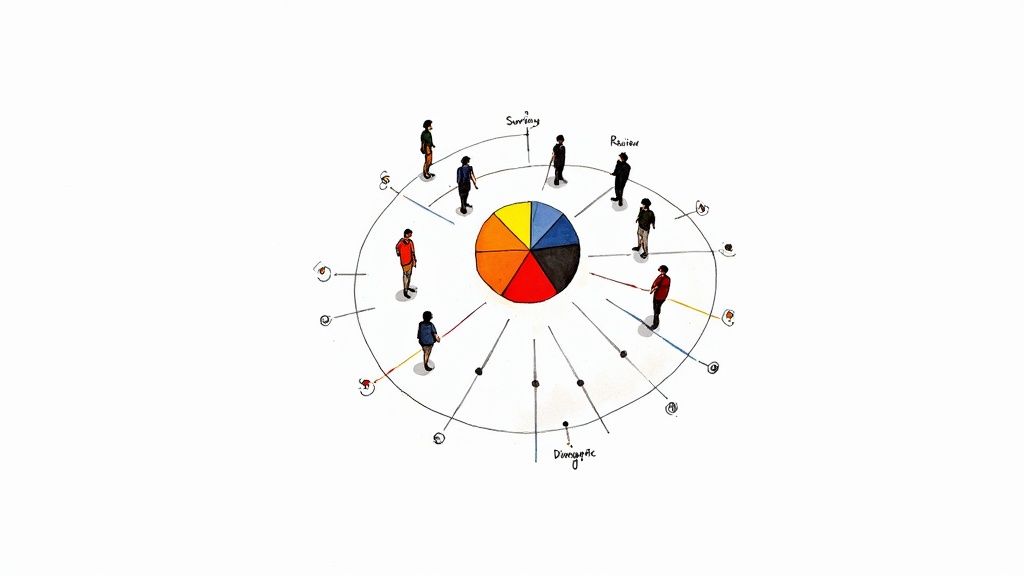
2. Market Research and Consumer Behavior Analysis Report
A Market Research and Consumer Behavior Analysis Report is an in-depth examination of a target market’s characteristics, preferences, buying habits, and emerging trends. It synthesizes quantitative data like surveys and sales figures with qualitative insights from focus groups or interviews. This comprehensive view informs critical business functions, from product development and marketing messaging to strategic positioning.
This report is vital for any company looking to enter a new market, launch a product, or refine its marketing strategy. By decoding the "why" behind consumer actions, it helps businesses create more effective campaigns and build stronger customer relationships, making it one of the most powerful analytical report examples for achieving market fit.
Strategic Breakdown
This type of analysis is the backbone of firms like Nielsen and McKinsey & Company, which provide global brands with intelligence on everything from Gen Z's social media habits to luxury brand perception in emerging economies. The core strategy is to move past simple demographics and uncover the psychographics, motivations, and pain points that drive consumer decisions. It's about understanding the entire customer journey, not just the final purchase.
Key Insight: The most impactful reports blend "what" people do (quantitative data) with "why" they do it (qualitative data). For example, data might show that 70% of millennials abandon online shopping carts, but qualitative interviews could reveal the cause is unexpected shipping costs or a complicated checkout process.
Actionable Takeaways for Your Agency
Agencies can leverage this report to craft hyper-targeted campaigns for clients or to identify new service opportunities.
- Create Detailed Personas: Use survey and interview data to build rich buyer personas that go beyond age and location to include motivations, challenges, and media consumption habits.
- Map the Customer Journey: Identify every touchpoint a consumer has with a brand, from initial awareness to post-purchase. Pinpoint where friction occurs and where there are opportunities for delight.
- Segment Your Audience: Don't treat your market as a monolith. Segment audiences by behavior, such as "frequent buyers," "deal-seekers," or "brand loyalists," to tailor your messaging.
- Validate Product-Market Fit: Before launching a new service or campaign, use this analysis to confirm there is a genuine need and willingness to pay within your target market.
3. Sales Performance and Pipeline Analysis Report
A Sales Performance and Pipeline Analysis Report is an operational tool that provides a detailed view of a company's revenue generation engine. It examines key sales metrics, tracks team performance, and assesses the health of the deal pipeline. By translating raw CRM data into clear insights, it helps sales leaders understand what’s working, what isn’t, and where to focus their efforts for maximum impact.
This report is crucial for accurate revenue forecasting, sales process optimization, and team management. It moves beyond simple "deals closed" metrics to analyze the entire sales funnel, identifying bottlenecks and opportunities for improvement. This makes it one of the most vital analytical report examples for any business focused on predictable growth.
Strategic Breakdown
Companies like Salesforce and HubSpot have built their platforms around the power of this analysis, enabling businesses to meticulously track every stage of their sales process. For example, a SaaS company can use this report to monitor Monthly Recurring Revenue (MRR) growth, while an enterprise software firm can track deal size and sales cycle length. The core strategy is to connect leading indicators (like new pipeline created) with lagging indicators (like closed-won revenue) to build a predictable sales model.
Key Insight: The most effective sales reports don't just track wins; they dissect the entire process. The analysis should pinpoint exactly where deals are stalling. For instance, if a high number of opportunities move from "Discovery" to "Proposal" but few progress to "Negotiation," it signals a potential issue with pricing, value proposition, or the proposal itself.
Actionable Takeaways for Your Agency
Agencies can leverage this report to manage their new business pipeline and improve client acquisition strategies.
- Balance Leading and Lagging Indicators: Track both closed deals (lagging) and the number of discovery calls booked or proposals sent (leading). This provides a more complete picture of future revenue health.
- Segment for Deeper Insights: Analyze your pipeline by service line, lead source, or client industry. You might discover that leads from referrals close twice as fast as those from paid ads.
- Analyze Pipeline Velocity: Calculate how long it takes for a deal to move through each stage. Identifying bottlenecks, like a slow contract review process, allows you to make targeted improvements.
- Conduct Win/Loss Analysis: Systematically review deals that were lost. Was it price, features, or timing? Use this report to find patterns and refine your sales pitch or service offerings accordingly.
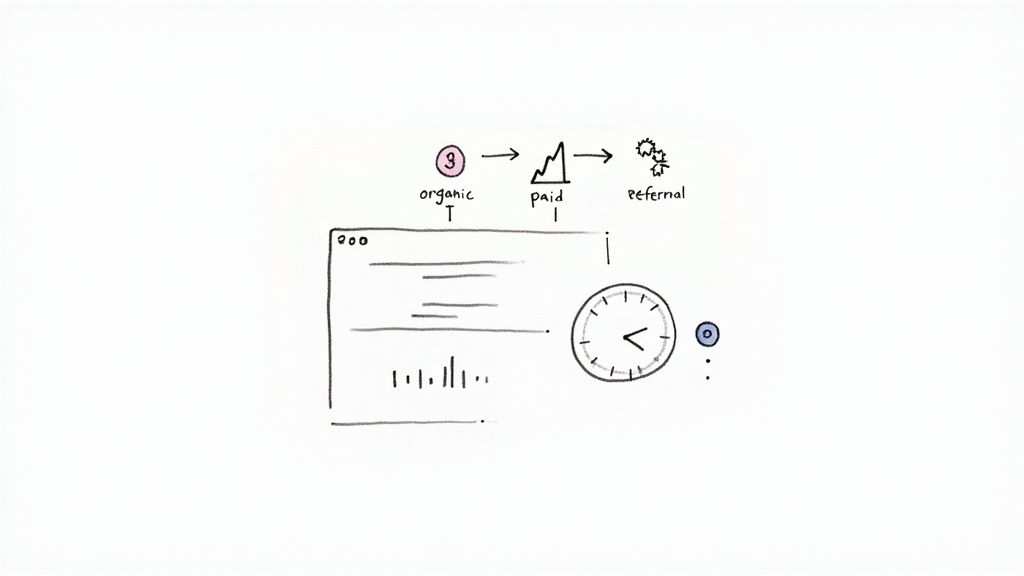
4. Website Traffic and User Engagement Analytics Report
A Website Traffic and User Engagement Analytics Report is a vital tool for understanding how an audience interacts with a digital property. It measures key performance indicators like traffic sources, user behavior, bounce rates, and conversion metrics to provide a clear picture of what’s working and what isn't. This analysis translates clicks, scrolls, and session data into strategic insights for optimizing the user journey and improving content effectiveness.
This report is fundamental for any business with a digital presence, from e-commerce sites to SaaS platforms. By dissecting the user funnel and identifying points of friction, it helps marketing, product, and web development teams make data-driven decisions. As one of the most dynamic analytical report examples, it forms the backbone of digital strategy and conversion rate optimization efforts.
Strategic Breakdown
Tools like Google Analytics and Mixpanel have made this type of report an industry standard. For example, an e-commerce brand might use this analysis to discover that mobile users from paid social campaigns have an unusually high cart abandonment rate, pinpointing a flaw in their mobile checkout process. Similarly, a SaaS company can analyze the user journey from a free trial sign-up to a paid subscription, identifying the specific features that drive conversion. The strategy is to connect user actions to business outcomes.
Key Insight: A great engagement report goes beyond vanity metrics like pageviews. It segments data to uncover hidden patterns. For instance, high overall traffic might mask the fact that a key demographic is dropping off, or that traffic from a high-cost channel isn't converting at all.
Actionable Takeaways for Your Agency
Agencies can use this report to demonstrate ROI for digital marketing clients or to refine their own web presence.
- Segment Traffic Sources: Analyze which channels (Organic, Paid, Social, Referral) drive the most engaged traffic. If a blog post gets thousands of social media views but has a 95% bounce rate, the content isn't aligned with the audience's intent.
- Map the User Journey: Use goal funnels to visualize where users drop off. A high exit rate on a pricing page could indicate confusing pricing tiers or a lack of clear calls-to-action.
- Monitor Core Web Vitals: Track metrics like Largest Contentful Paint (LCP) and Cumulative Layout Shift (CLS). A poor score can directly impact user experience and SEO rankings, providing a clear, technical action item.
- Use UTM Parameters Religiously: Ensure every campaign has unique UTM codes. This allows you to attribute conversions precisely and determine which specific email, ad, or social post is delivering the best results.
5. Employee Performance and HR Analytics Report
An Employee Performance and HR Analytics Report transforms human resources from an administrative function into a strategic powerhouse. It systematically evaluates employee productivity, engagement, retention, and performance metrics to provide a data-driven view of the workforce. This report moves beyond gut feelings and anecdotal evidence, offering clear insights into what drives a healthy, high-performing organizational culture.
This analysis is critical for talent management, succession planning, and operational efficiency. By correlating metrics like employee engagement scores with productivity and attrition rates, leaders can proactively address issues, identify future leaders, and optimize their human capital, making it one of the most vital analytical report examples for sustainable growth.
Strategic Breakdown
Modern HR platforms like Workday, Culture Amp, and LinkedIn Talent Solutions have popularized this data-first approach to people management. Tech companies often use it to analyze developer productivity by tracking metrics like code commits and review cycle times. The core strategy is to connect people data directly to business outcomes, demonstrating how investments in employee well-being and development translate into tangible ROI.
Key Insight: A powerful HR analytics report balances quantitative data with qualitative context. High turnover is a problem, but the report must answer why it's happening. By segmenting attrition data by manager, department, or tenure, you can pinpoint specific issues, like a need for better management training or improved onboarding processes.
Actionable Takeaways for Your Agency
Agencies can leverage this report to build a more resilient and effective team.
- Predict Attrition Risks: Track leading indicators like employee satisfaction scores (eNPS) and one-on-one frequency. A sudden drop in engagement within a specific team can be an early warning sign of potential departures.
- Identify High Performers: Look beyond simple revenue numbers. Analyze who consistently receives positive peer feedback, completes training, and contributes to internal initiatives. This identifies future leaders who embody company values.
- Optimize Resource Allocation: Segment productivity metrics by role and project. If one team consistently logs excessive overtime to meet deadlines, it may signal a need for more staff, better processes, or additional training.
- Enhance Onboarding: Analyze the performance and retention rates of new hires over their first 90 days. A high failure rate in a particular department could indicate that the onboarding process for that team is broken and needs immediate attention.
6. Supply Chain and Inventory Management Analysis Report
A Supply Chain and Inventory Management Analysis Report is an operational deep dive into the flow of goods, from procurement to final delivery. It examines inventory levels, supply chain efficiency, vendor performance, and demand forecasting to optimize turnover, reduce carrying costs, and prevent stockouts. This report translates complex logistics data into a clear picture of operational health and resilience.
This analysis is critical for any business handling physical products, as it directly impacts profitability and customer satisfaction. By scrutinizing metrics like inventory turnover ratio, order fulfillment cycle time, and supplier reliability, leaders can make informed decisions to streamline operations and mitigate risks, making it one of the most vital analytical report examples for retail, manufacturing, and e-commerce.
Strategic Breakdown
Global retailers like Walmart and Amazon have built empires on the back of sophisticated supply chain analysis. They use these reports to forecast seasonal demand with incredible accuracy, ensuring products like holiday toys or summer apparel are stocked just in time. The core strategy is to use data not just to see what happened, but to predict what will happen and proactively adjust inventory and logistics to meet future demand.
Key Insight: The most effective supply chain reports integrate data from multiple sources. They don't just look at warehouse inventory; they connect it to sales forecasts, supplier lead times, and even external factors like shipping lane disruptions. This holistic view turns the supply chain from a cost center into a strategic advantage.
Actionable Takeaways for Your Agency
While less common for digital agencies, this report format is invaluable for e-commerce clients or internal swag management.
- Analyze Inventory Turnover: Calculate the inventory turnover ratio (Cost of Goods Sold / Average Inventory). A low ratio for a client's product might indicate overstocking or poor sales, signaling a need for a new marketing campaign.
- Evaluate Supplier Performance: Track key supplier metrics like on-time delivery rate and order accuracy. If a key supplier consistently underperforms, it's a data-backed reason to renegotiate terms or find an alternative.
- Optimize Order Fulfillment: Map the time from when a customer places an order to when they receive it. Identifying bottlenecks in this process, such as slow warehouse picking, can drastically improve customer satisfaction.
- Forecast Future Demand: Use historical sales data to forecast future inventory needs. This prevents costly stockouts on popular items and avoids tying up cash in slow-moving products.
7. Marketing Campaign ROI and Attribution Analysis Report
A Marketing Campaign ROI and Attribution Analysis Report is a critical tool for modern marketers, designed to measure a campaign's financial return and decipher the customer journey. It moves beyond vanity metrics like clicks and impressions to connect marketing activities directly to revenue, assigning value to each touchpoint that influences a conversion. This report dissects which channels, campaigns, and creative assets are most effective at driving business results.
This analysis is indispensable for optimizing marketing spend and proving the department's value. By understanding how different channels work together, marketers can allocate budgets more intelligently and refine strategies for maximum impact. This makes it one of the most powerful analytical report examples for data-driven teams.
Strategic Breakdown
Marketing automation platforms like Marketo and Hubspot, along with Google Analytics 4, have popularized this type of report by building sophisticated attribution modeling features. The core strategy is to move from a last-click attribution model, which gives 100% of the credit to the final touchpoint, to a multi-touch model that provides a more holistic view of the customer journey. For example, a B2B software company might discover that while paid search closes deals, blog posts and webinars are crucial for initial awareness.
Key Insight: The goal of attribution is not to find a single "perfect" model but to understand the relative influence of different channels. The analysis should compare various models (e.g., linear, time-decay, data-driven) to reveal which touchpoints are consistently undervalued and deserve more investment.
Actionable Takeaways for Your Agency
Agencies can leverage this report to demonstrate tangible value and guide client strategy.
- Calculate Channel-Specific ROI: Move beyond overall campaign ROI. Calculate the Return on Ad Spend (ROAS) for each channel (e.g., Google Ads, Facebook, LinkedIn) to identify top performers and underachievers.
- Map the Customer Journey: Use attribution data to visualize the most common conversion paths. You might find a high-value path is "Social Media Ad > Blog Post > Email Nurture > Demo Request."
- Analyze Cost Per Acquisition (CPA): Track CPA by campaign and channel. If a new campaign has a CPA that is 50% higher than your average, this report forces you to investigate whether the lead quality justifies the higher cost.
- Measure Lifetime Value (CLV): Connect attribution to long-term value. A channel might have a high initial CPA but attract customers with a much higher CLV, making it a more profitable investment over time.
8. Product Usage and Feature Adoption Analytics Report
A Product Usage and Feature Adoption Analytics Report is a critical tool for product-led organizations, providing a deep dive into how users interact with a product. It analyzes feature utilization, user adoption rates, and overall engagement trends to guide product development. This report translates raw user behavior data into clear insights about which features are valuable, which are ignored, and where users get stuck.
This analysis is foundational for refining the user experience, prioritizing the product roadmap, and validating product-market fit. By quantifying user engagement, it helps product managers make data-driven decisions instead of relying on assumptions, making it one of the most powerful analytical report examples for software and digital product companies.
Strategic Breakdown
Product analytics platforms like Amplitude and Mixpanel have built their entire businesses around enabling this type of report. SaaS giants like Slack and Miro constantly analyze feature adoption to understand which functionalities drive team collaboration and lead to account expansion. The core strategy is to identify the "aha moments" and "sticky features" that correlate with long-term user retention and turn casual users into power users.
Key Insight: A valuable feature adoption report goes beyond tracking clicks. It segments users to understand who is adopting features and why. For instance, a new feature might see low overall adoption but be a game-changer for a specific high-value customer segment, indicating a powerful niche use case.
Actionable Takeaways for Your Agency
Agencies developing web apps, mobile apps, or SaaS products for clients can use this format to demonstrate value and guide development.
- Segment by User Cohort: Analyze feature adoption for new users versus established users. This can reveal if your onboarding process effectively introduces key features.
- Track Time-to-Value: Measure how long it takes for a new user to adopt a "sticky" feature. If the time is too long, it signals a need to simplify the user journey or improve in-app guidance.
- Identify 'Dead' Features: Pinpoint features with consistently low usage. This report provides the evidence needed to decide whether to improve, reposition, or sunset a feature, freeing up development resources.
- Combine Quantitative with Qualitative: Use the data to identify users who have either abandoned or heavily adopted a new feature. Follow up with them for qualitative interviews to understand the context behind their behavior.
9. Quality Assurance and Defect Analysis Report
A Quality Assurance (QA) and Defect Analysis Report is an operational tool that provides a systematic review of a product's quality, stability, and testing effectiveness. It translates raw data on bugs, test cases, and resolution times into critical insights about product health and development process efficiency. This report goes beyond a simple bug count, helping teams identify recurring issues, bottlenecks, and areas for process improvement.
This analysis is vital for software development, manufacturing, and any industry where product quality is paramount. By tracking defect trends, testing coverage, and resolution speeds, it enables teams to make data-driven decisions on resource allocation and process refinement, solidifying its place among essential analytical report examples for technical and operational teams.
Strategic Breakdown
Modern QA reporting is powered by platforms like Jira and TestRail, which allow teams to track defect density and escape rates in real-time. For instance, a software company might use this report to analyze why a particular feature consistently generates more critical bugs post-release. The strategy is to move from a reactive "find and fix" model to a proactive "predict and prevent" approach by identifying systemic weaknesses in the development lifecycle.
Key Insight: A powerful QA report focuses on trends and root causes, not just numbers. It should answer why defects are happening. For example, a spike in bugs after a specific sprint might indicate a knowledge gap, insufficient testing for a new technology, or unrealistic deadlines impacting code quality.
Actionable Takeaways for Your Agency
Agencies can use this report format to improve the quality of client deliverables and optimize internal development processes.
- Prioritize High-Impact Defects: Track "defect severity" and "defect priority" instead of just the total number of bugs. A single critical bug can be more damaging than 20 minor UI issues.
- Analyze Defect Leakage: Monitor how many bugs are found by clients after a release versus those caught internally. A high leakage rate signals that your testing process needs to be more robust.
- Conduct Root Cause Analysis: For recurring or critical defects, document the root cause. Was it a vague requirement, a coding error, or an environmental issue? This data helps prevent future occurrences.
- Implement "Shift-Left" Testing: Use the report to advocate for integrating QA earlier in the development process. Introducing testing during the design and requirements phases is far more cost-effective than fixing bugs post-launch.
10. Customer Satisfaction and Net Promoter Score (NPS) Analysis Report
A Customer Satisfaction and Net Promoter Score (NPS) Analysis Report provides a quantitative and qualitative measure of customer loyalty and experience. It synthesizes feedback from surveys, reviews, and direct interactions to gauge how customers perceive a brand, product, or service. The report primarily focuses on metrics like NPS, Customer Satisfaction (CSAT), and Customer Effort Score (CES) to identify promoters, passives, and detractors.
This analysis is critical for understanding customer health, predicting churn, and identifying specific areas for service and product improvement. By turning sentiment into data, it helps organizations prioritize changes that will have the greatest impact on customer retention and advocacy, making it one of the most vital analytical report examples for a customer-centric business.
Strategic Breakdown
Pioneered by Bain & Company, the NPS framework is famously used by companies like Apple and Amazon to maintain an obsessive focus on customer experience. A retail bank, for example, might use this report to discover that while customers are satisfied with in-branch services (high CSAT), they find the mobile banking app difficult to use (low CES), resulting in a poor overall NPS. The strategy is to connect direct customer feedback to specific operational touchpoints, revealing the root causes of satisfaction or dissatisfaction.
Key Insight: The real value of an NPS report isn't the score itself, but the "why" behind it. The analysis must deeply examine the open-ended feedback from detractors and promoters to uncover recurring themes. A score tells you what is happening; the qualitative comments tell you why it’s happening.
Actionable Takeaways for Your Agency
Agencies can leverage this report format to measure client satisfaction and identify opportunities for service improvement.
- Segment Your Audience: Don't just look at one overall NPS score. Segment results by client size, industry, or service package to identify if specific cohorts are less satisfied than others.
- Correlate to Business Outcomes: Map your NPS and CSAT scores against client retention rates and project profitability. This helps prove the ROI of improving the client experience.
- Close the Loop with Detractors: Create a formal process for following up with any client who gives a low score. Use this as an opportunity to resolve their issue and show that you value their feedback.
- Analyze Qualitative Feedback: Use text analysis on open-ended comments to identify themes. Are clients consistently praising your project management but criticizing the reporting process? This is a clear signal for where to focus improvements.
Comparison of 10 Analytical Reports
| Report Type | Implementation Complexity 🔄 | Resource Requirements ⚡ | Expected Outcomes 📊 | Ideal Use Cases 💡 | Key Advantages ⭐ |
|---|---|---|---|---|---|
| Financial Performance Analysis Report | High — multi-statement reconciliation, accounting expertise required | Medium–High — financial systems, analysts, historical data | Clear view of profitability, liquidity, solvency; trend forecasting | Investor reporting, strategic planning, compliance | Informs investment/resource allocation; highlights financial strengths/weaknesses |
| Market Research and Consumer Behavior Analysis Report | High — mixed methods and qualitative interpretation | High — surveys, panels, moderators, analysts | Market sizing, segmentation, consumer preferences and trends | New product launch, positioning, pricing strategy | Reduces product risk; enables precise targeting |
| Sales Performance and Pipeline Analysis Report | Medium — CRM integration and pipeline modelling | Medium — CRM, sales analytics, clean data | Pipeline health, revenue forecasts, performance diagnostics | Sales ops, quota setting, coaching and incentive design | Improves forecasting; identifies bottlenecks and top performers |
| Website Traffic and User Engagement Analytics Report | Medium — tagging, attribution, privacy considerations | Medium — analytics platforms, tag management, engineers | Traffic sources, conversion funnels, content and UX insights | Digital marketing optimization, CRO, content strategy | Real-time visibility; optimizes campaigns and user experience |
| Employee Performance and HR Analytics Report | High — privacy, bias mitigation, multi-source integration | Medium–High — HRIS, survey platforms, analytics expertise | Talent identification, attrition prediction, engagement measures | Workforce planning, succession, retention programs | Enables data-driven HR decisions; reduces turnover risk |
| Supply Chain and Inventory Management Analysis Report | High — complex forecasting and network modelling | High — ERP/SCM systems, real-time tracking, data integration | Optimized inventory, lower carrying costs, fewer stockouts | Demand planning, sourcing strategy, fulfillment optimization | Improves cash flow; enhances supply chain resilience |
| Marketing Campaign ROI and Attribution Analysis Report | High — multi-touch attribution and cross-channel modelling | High — tracking stack, attribution tools, data science | Clearer ROI, channel performance, optimized spend allocation | Campaign budgeting, channel optimization, incrementality testing | Demonstrates ROI; improves marketing spend efficiency |
| Product Usage and Feature Adoption Analytics Report | Medium — event instrumentation and cohort analysis | Medium — product analytics tools, instrumentation effort | Feature adoption rates, onboarding effectiveness, retention drivers | Roadmap prioritization, onboarding optimization, feature discovery | Identifies value-driving features; validates roadmap decisions |
| Quality Assurance and Defect Analysis Report | Medium–High — root-cause analysis and coverage measurement | Medium — testing tools, QA teams, automation frameworks | Reduced defect rates, improved MTTR, higher release quality | Release readiness, manufacturing QA, sprint quality monitoring | Prevents customer-impacting defects; improves reliability |
| Customer Satisfaction and Net Promoter Score (NPS) Analysis Report | Medium — survey design, bias correction, closed-loop processes | Medium — survey/CX platforms, feedback channels | Loyalty measurement, churn risk flags, thematic feedback insights | Customer retention programs, service improvement, benchmarking | Measures loyalty; surfaces actionable customer feedback |
Building Your Agency's Single Source of Truth
Throughout this guide, we've dissected ten distinct analytical report examples, from financial performance deep dives to customer satisfaction benchmarks. Each example, whether tracking marketing campaign ROI or analyzing product feature adoption, underscores a fundamental principle: data is the language of modern business, and fluency is non-negotiable for growth. We moved beyond surface-level descriptions to reveal the strategic framework behind each report, providing actionable takeaways and replicable methods for your agency.
The goal was not just to show you what a good report looks like, but to equip you with the strategic insight to build your own. These examples demonstrate that the most powerful reports do more than just present numbers; they narrate a story, diagnose problems, and illuminate a clear path forward. They transform raw data points into a cohesive, strategic compass that guides decision-making across every department.
From Silos to Synthesis: The Core Takeaway
The most critical takeaway from analyzing these diverse reports is the immense value of integrated data. A standalone Sales Performance Report is useful, but its power multiplies when connected to insights from a Marketing Campaign ROI Analysis. Similarly, a Customer Satisfaction Report becomes profoundly more actionable when cross-referenced with data from a Product Usage and Defect Analysis.
The challenge for most agencies isn't a lack of data; it's the fragmentation of that data across disconnected platforms. When your project management tool, CRM, financial software, and support desk don't communicate, creating a holistic analytical report becomes a grueling, manual task plagued by potential errors and outdated information. This operational friction is a silent killer of efficiency and strategic agility.
Key Learnings from Our Analytical Report Examples:
To crystallize the lessons from the examples we've explored, consider these core principles as you refine your agency's reporting strategy:
- Context is Everything: Numbers without context are meaningless. As seen in the Website Traffic and User Engagement report, knowing why a spike occurred (e.g., a specific marketing campaign) is more important than just knowing it happened. Always connect the "what" with the "why."
- Focus on Leading Indicators: While lagging indicators like quarterly revenue are essential, leading indicators like sales pipeline velocity or NPS trends provide a forward-looking view. Prioritize metrics that predict future outcomes, not just those that report on the past.
- Visuals Drive Comprehension: A well-designed chart or graph communicates complex information far more effectively than a dense table of numbers. Use data visualization to highlight key trends and make insights instantly digestible for stakeholders at all levels.
- Actionability is the Goal: Every report must conclude with clear, actionable recommendations. The true measure of a report's value is the quality of the decisions it inspires. Without a "what next" section, a report is merely a historical document.
Your Next Step: Unifying Your Data Foundation
Mastering the creation of these analytical report examples is a crucial step toward building a data-driven culture within your agency. It empowers your team to move from reactive problem-solving to proactive strategy, grounded in empirical evidence. By adopting the structures, metrics, and strategic thinking outlined here, you can transform your reporting from a dreaded administrative chore into a powerful engine for sustainable growth. The final, and most impactful, step is to build the operational foundation that makes this level of analysis seamless and scalable.
The analytical report examples in this article reveal a universal truth: high-performing organizations run on integrated, contextual data. RGK was built to eliminate the operational friction caused by siloed tools by unifying your agency's core functions into a single operating system. Stop wrestling with disconnected data and start building your single source of truth to transform reporting from a painful chore into a strategic advantage.